Author: Livia Tay, MY
Last Updated: March 3, 2025
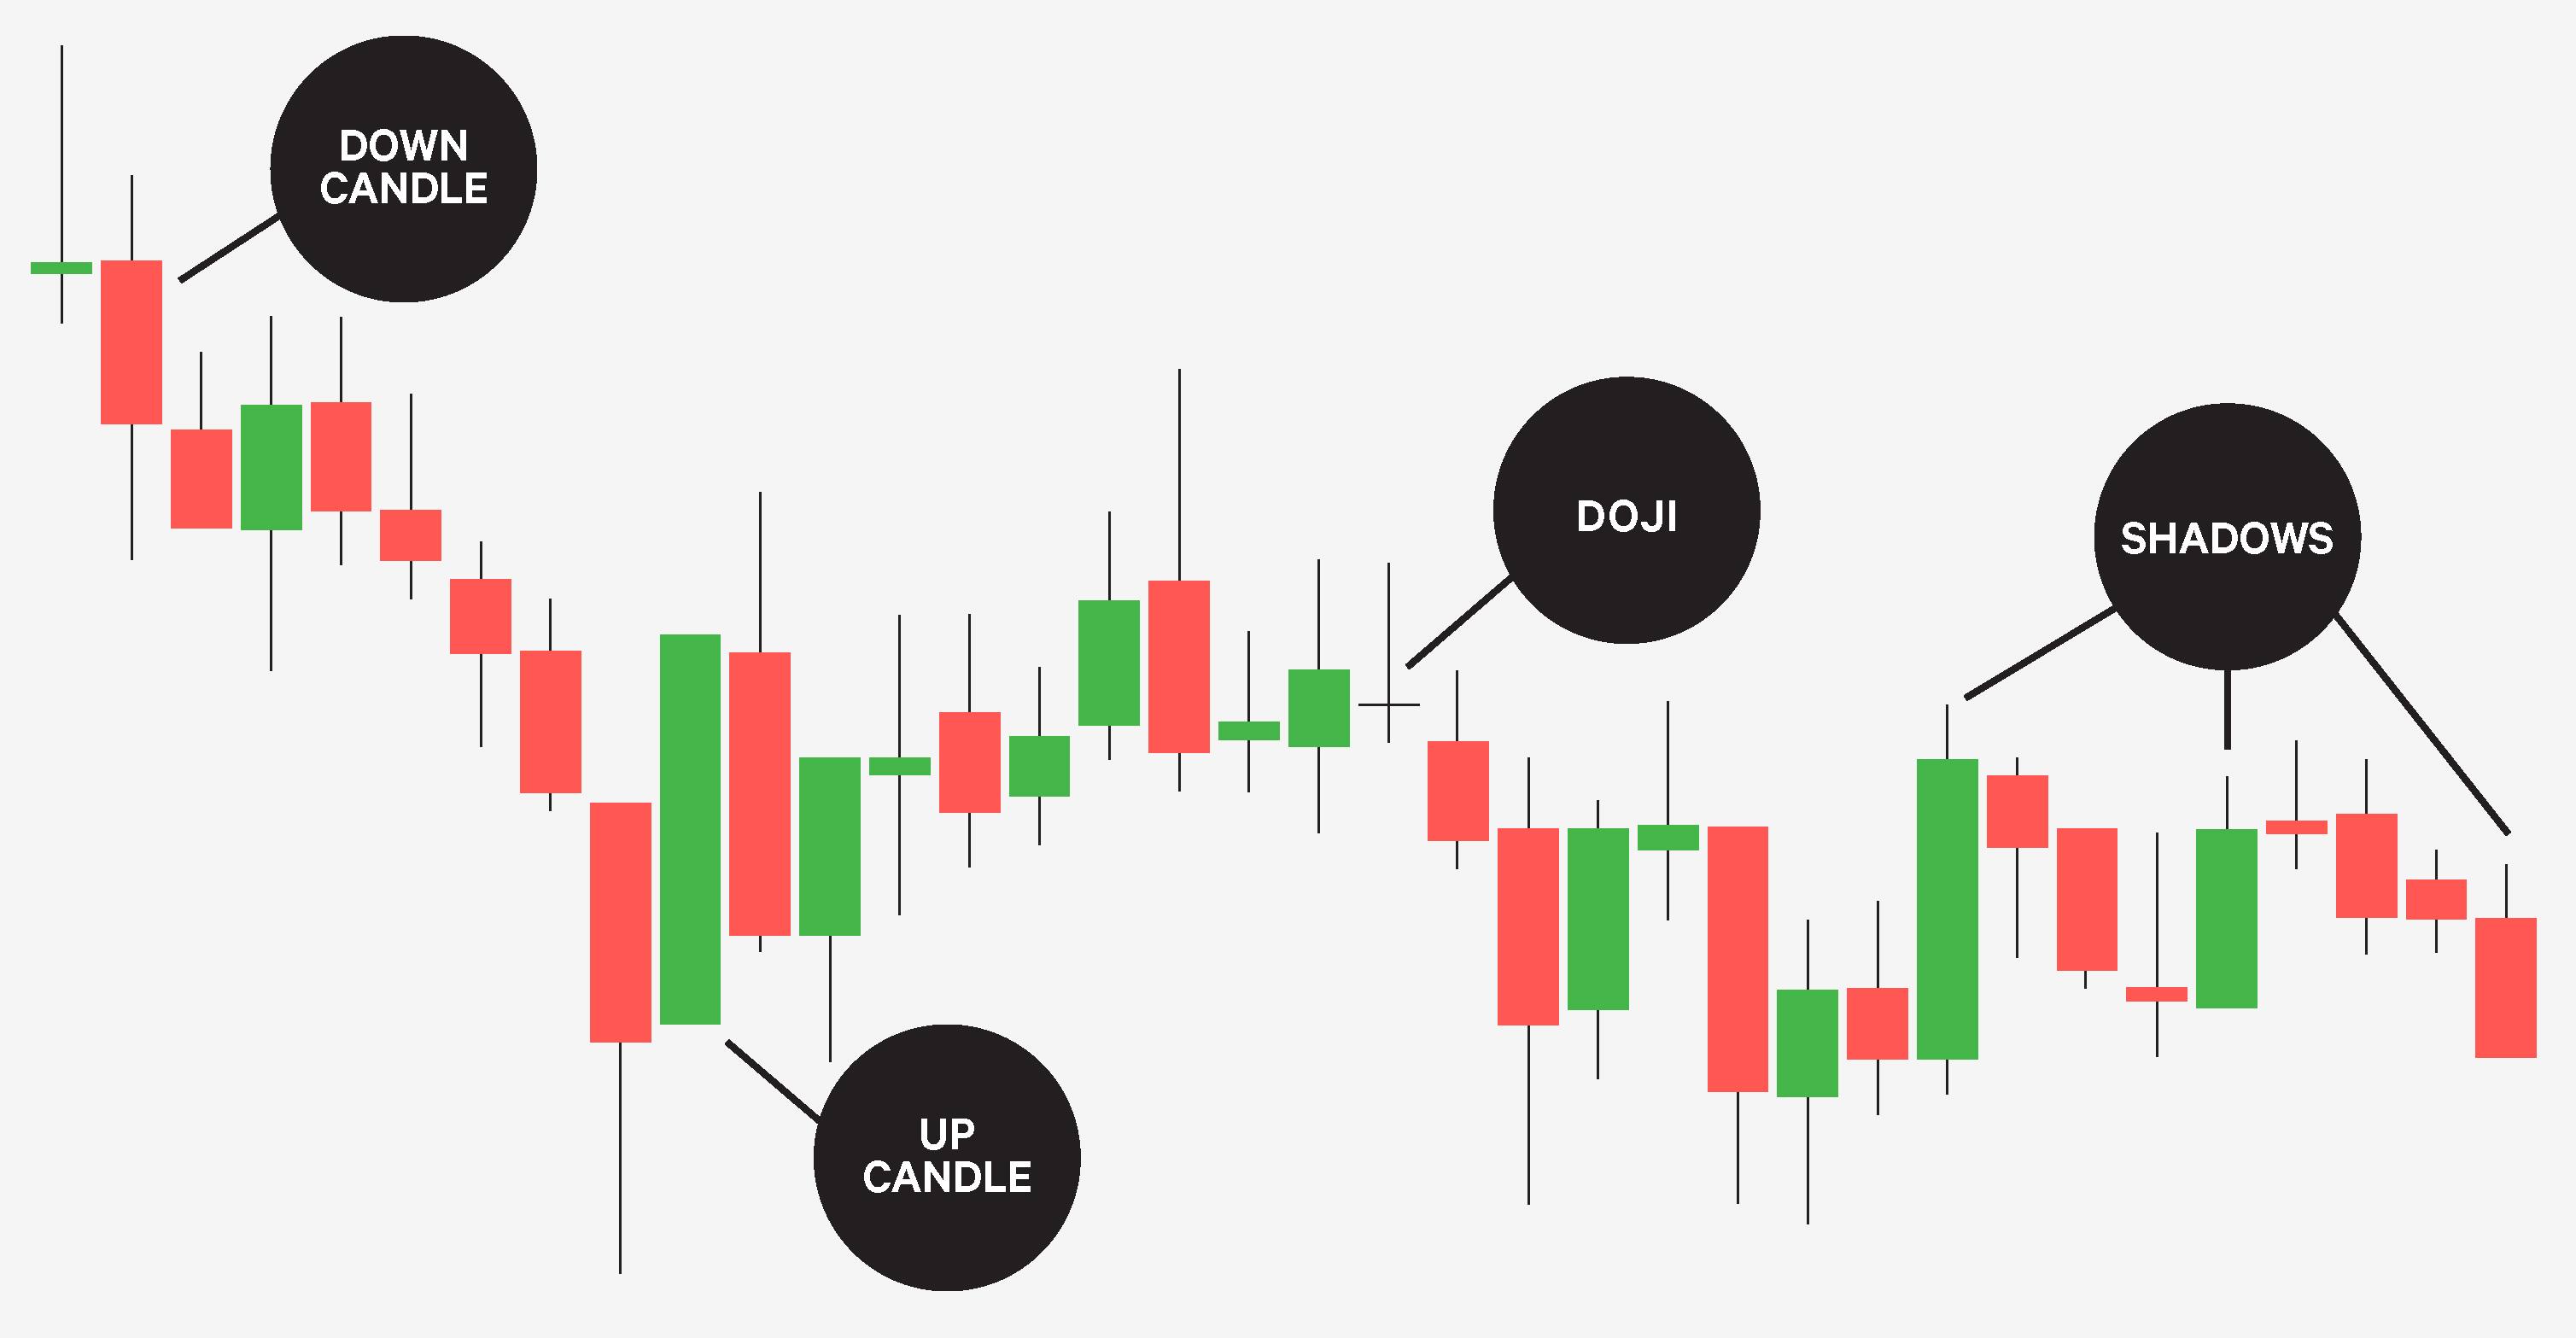
A candlestick represents how the price of an asset moves within a specific time period (e.g., 1 hour, 1 day).
Explaination of Candlestick Charts
-
Body – Shows the opening and closing price.
- 🔴 Red Candle (Bearish) → Price went down.
- 🟢 Green Candle (Bullish) → Price went up.
-
Wicks (Shadows) – Show the highest and lowest price reached.
Basic Candlestick Patterns
a. Bullish Candles (Uptrend) → Price is increasing.
b. Bearish Candles (Downtrend) → Price is decreasing.
Key Patterns to Know
- Doji → Market is undecided.
- Hammer → Possible price increase.
- Shooting Star → Possible price drop.
- Engulfing → Strong reversal signal.